Forecasting Financial Markets Using Multifractal Neural Networks
Introduction
Contemporary approaches to financial-market forecasting traditionally rely on statistical methods, machine learning, and neural networks that analyze large volumes of historical data.
However, all of these encounter a fundamental limitation: the high volatility and fractal nature of market processes significantly reduce the robustness and generalizability of such models [1–5].
The Teresius AI Concept
Within the Teresius AI project, a fundamentally new approach has been developed – one that identifies and exploits multifractal regularities in price behavior [6–10] through a proprietary technology.
These regularities manifest within the time-series data of various financial instruments – from Forex currency pairs to cryptocurrencies – and make it possible to construct a universal data representation independent of the specific asset.
Since the work of Benoît Mandelbrot [11], numerous studies have proposed different ways to detect multifractal structures in financial markets. Typically, multifractals are characterized by their multifractal spectrum, computed via conventional construction methods and related mathematical techniques.
Despite these efforts, significant progress in building effective models for financial-market forecasting has yet to be achieved.
Meanwhile, experienced discretionary traders have for decades observed recurring visual patterns on market charts-patterns they actively use in trading. In most cases, these patterns display remarkable geometric similarity across diverse asset classes.
The core idea behind the Teresius AI technology is that the model is trained not on absolute price values, but on the multifractal characteristics of their variation – structures visually similar to the patterns traders intuitively recognize, such as Elliott waves, Fibonacci ratios, and fractal levels.
Consequently, the Teresius AI neural network operates not with the “price” itself, but with its internal dynamic structure.
Model Universality
This architecture enables a single model to effectively forecast the movement of hundreds of financial instruments, including roughly 500 Forex pairs and 300 cryptocurrency pairs.
Forecast accuracy is assessed using the standard deviation of the prediction error (σ), which – across six timeframes (30 min, 1 h, 2 h, 4 h, 1 d, 1 w) – is found to be two-fold or more below current market volatility.
This indicates that the model successfully identifies stable structural patterns characteristic of contemporary market dynamics.
Forecast Examples
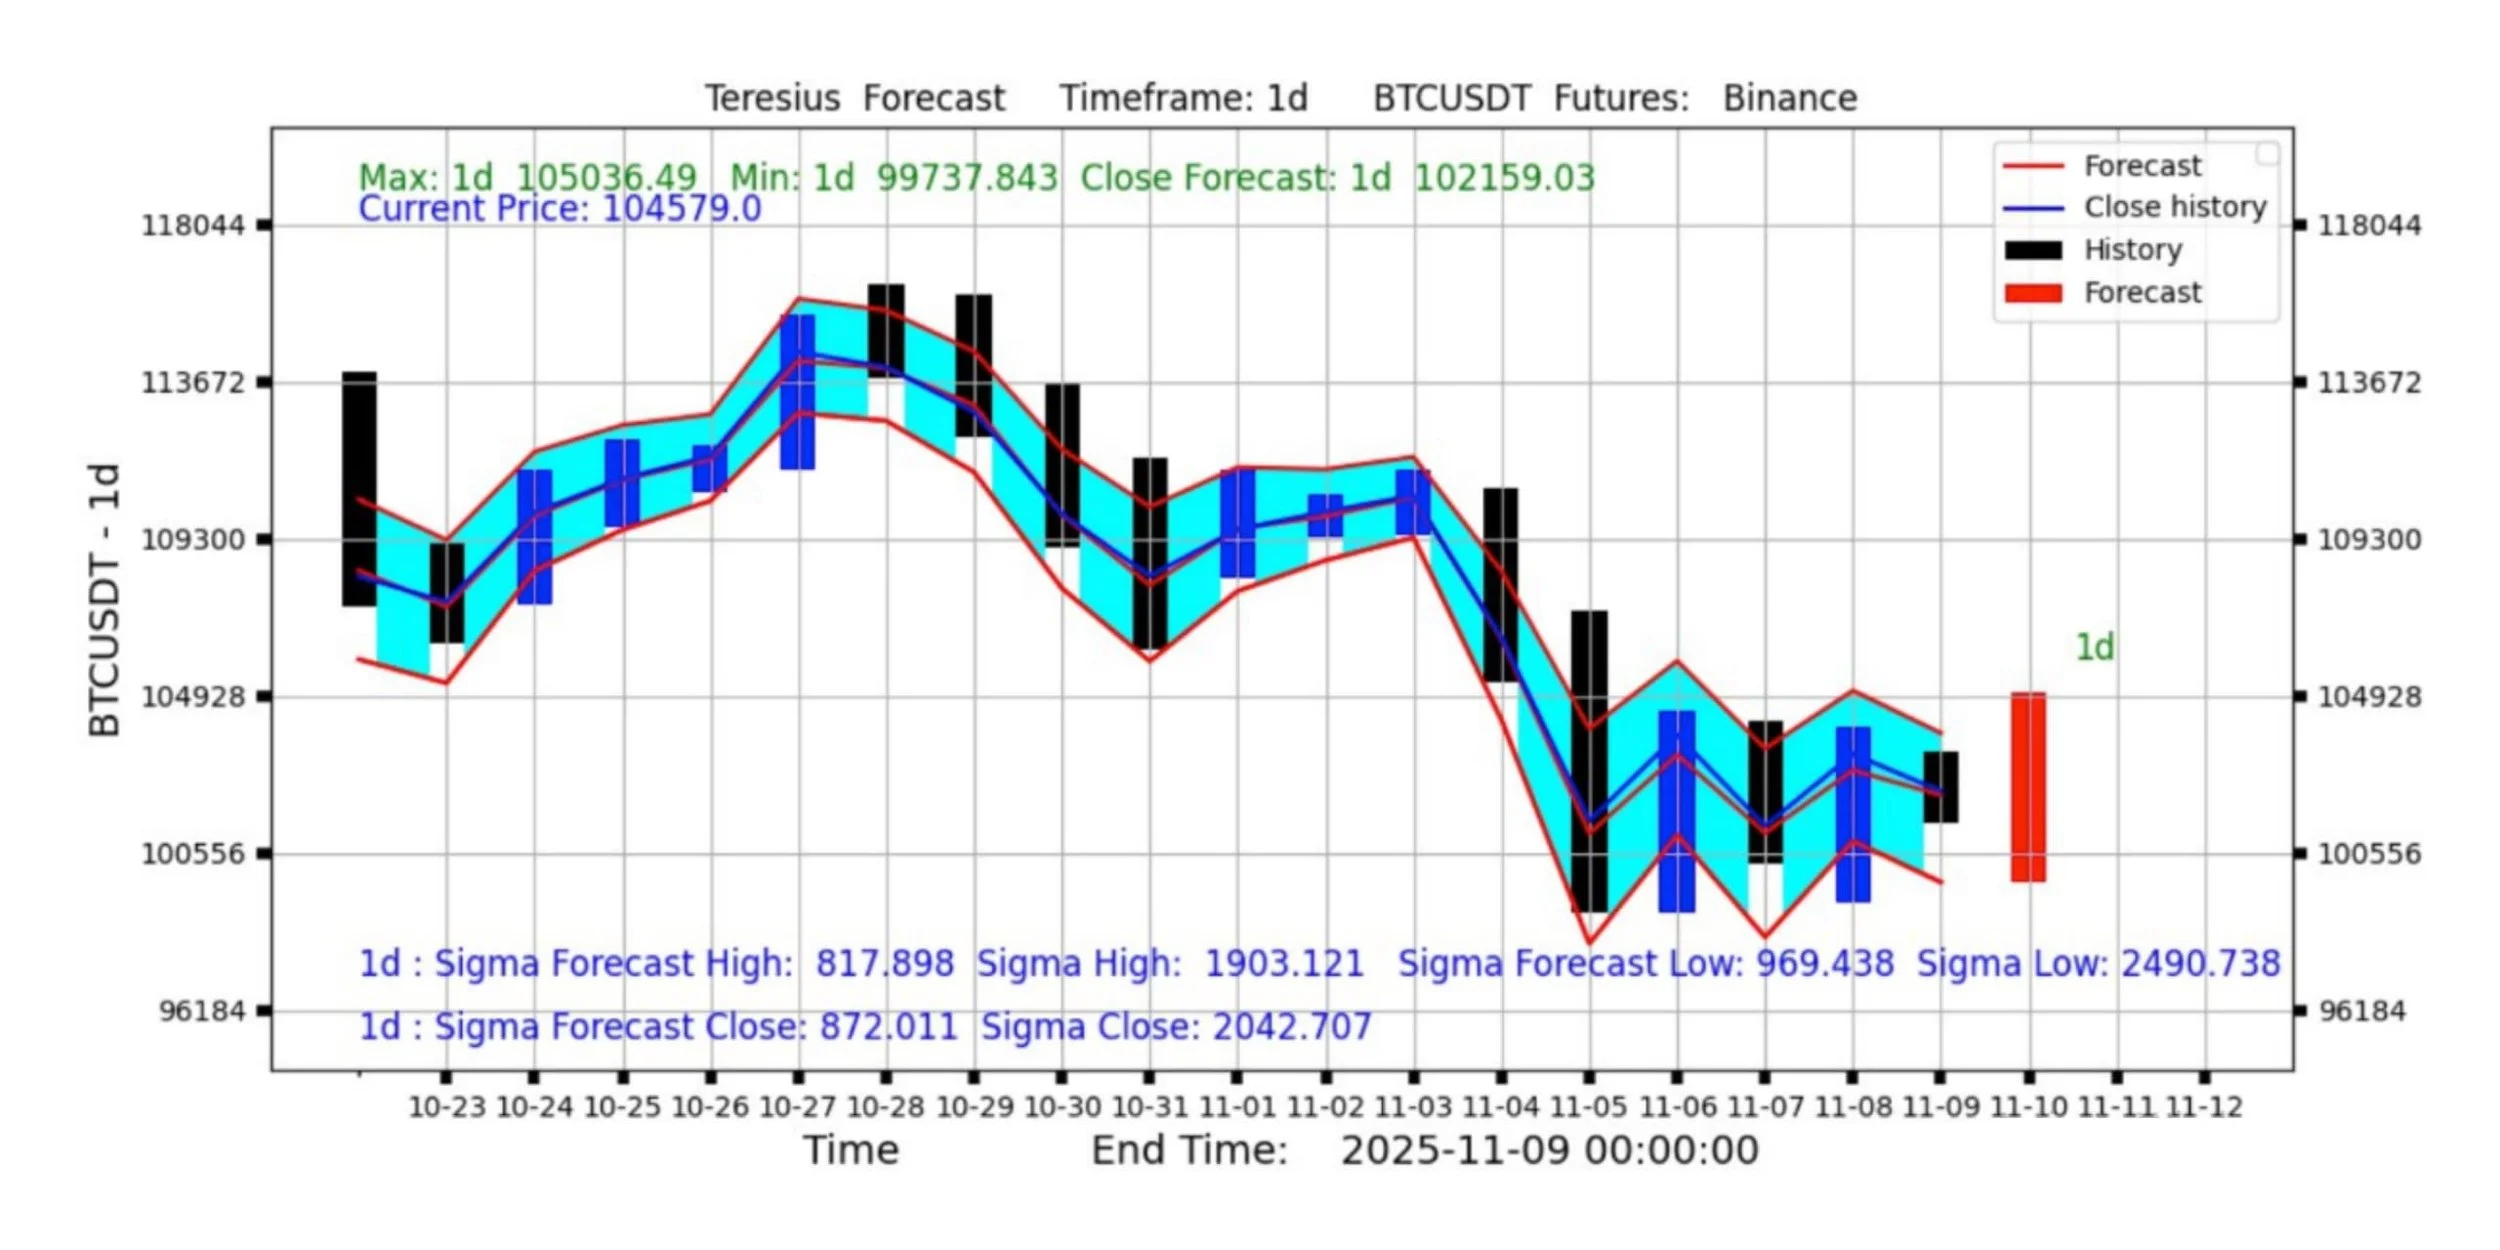
Figure 1. Example of Teresius AI Forecast for BTCUSDT
The model demonstrates directional consistency with actual market movement and resilience to short-term fluctuations.
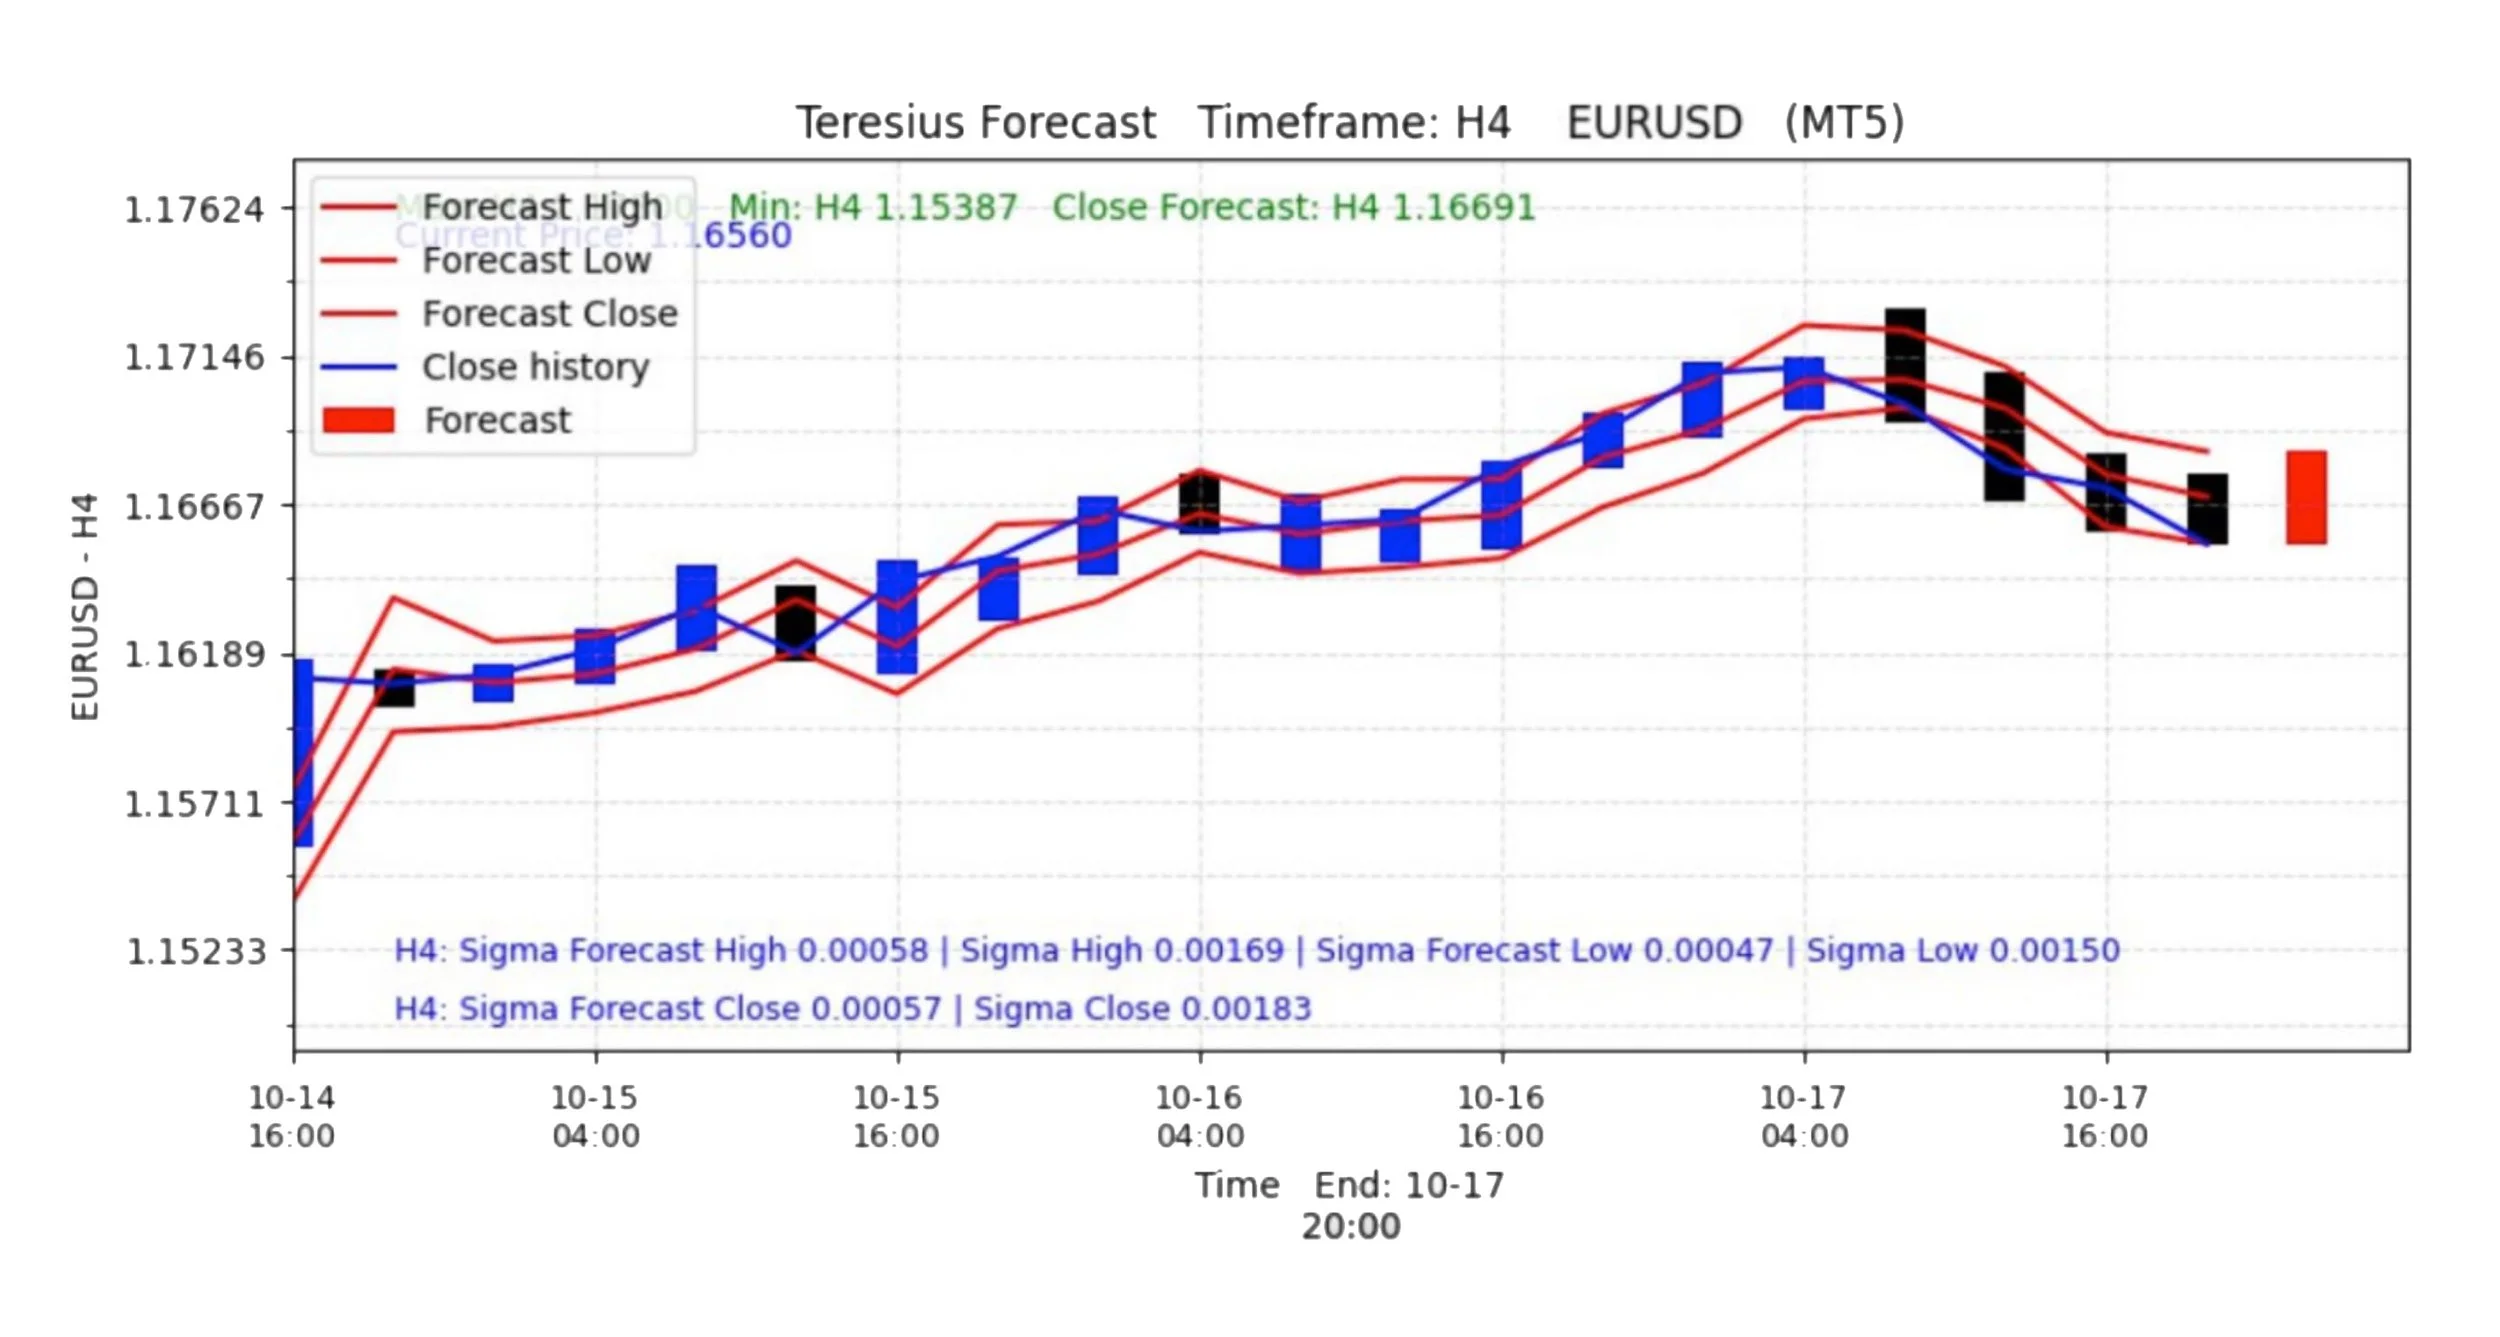
Figure 2. Example of Teresius AI Forecast for EURUSD
The characteristic multifractal structure enables the identification of reversal zones and stability ranges.
Practical Implementation
The working implementation of the model is presented through two Telegram bots:
@teresius_ai_bot
@teresius_ai_forex_bot
Users can receive real-time forecasts for selected financial instruments and visually observe how multifractal patterns shape directional predictions of market movement.
Conclusions
Teresius AI demonstrates the feasibility of constructing a universal forecasting model based not on statistical approximation, but on an understanding of the fundamental structural dynamics of market behavior.
This paves the way toward a new generation of analytical tools that unite classical trading methodology with modern artificial-intelligence technologies.
Neural Networks for Financial Time Series Forecasting — Paulo Canas Rodrigues, Entropy 2022. MDPI
Stock Market Forecasting Using a Neural Network Through Fundamental Indicators, Technical Indicators and Market Sentiment Analysis — Computational Economics, 2024/2025. SpringerLink
A review of two decades of correlations, hierarchies, networks and clustering in financial markets — Marti et al., 2017. arXiv
Deep Learning for Financial Time Series Prediction: A State‑of‑the‑Art Review of Standalone and Hybrid Models — Weisi Chen et al., 2024. OUCI
Artificial Intelligence Systems in the Financial Market Predictions: Literature Review — Kushnir & Tokareva, 2020.
Multifractal analysis of financial markets: a review — Jiang, Xie, Zhou & Sornette, 2019. Scinapse+1
Understanding the source of multifractality in financial markets — Barunik, Aste, Di Matteo & Liu, 2012. The Australian National University+1
Multifractal Behaviors of Stock Indices and Their Ability to Improve Forecasting in a Volatility Clustering Period — Zhang & Fang, Entropy 2021. MDPI
Multifractal Analysis of Market Efficiency across Structural Breaks: Implications for the Adaptive Market Hypothesis — Patil & Rastogi, J. Risk Financial Management, 2020. MDPI
Cross‑Correlation Multifractal Analysis of Technological Innovation, Financial Market and Real Economy Indices — Ke, Duan, Xu & Zhang, Fractal Fract. 2023. MDPI
Mandelbrot B. B. The Fractal Geometry of Nature.–– San Francisco, CA: Freeman.––1982