MARKET QUOTATION FORECAST FOR
BITCOIN (BTCUSDT)
“TERESIUS FORECAST”
User Manual
2024
Table of Contents
- INTRODUCTION
1.
DESCRIPTION OF THE
PHYSICO-MATHEMATICAL PRINCIPLES OF FORECASTING
2.
WORKING WITH THE SYSTEM
INTRODUCTION
This
version (TERESIUS_FORECAST.exe) of the software complex (hereinafter referred
to as the System) is designed to address the task of
FORECASTING MARKET QUOTATIONS FOR BITCOIN (BTCUSDT) (Web version of the system
for individual users).
Currently, there are numerous approaches and systems that
tackle the problem of forecasting cryptocurrency
market quotations. The proposed version of the system significantly differs
from most existing approaches and systems. The
software system “takes the initiative” to forecast specific high and low values
of BTCUSDT quotations for 30 minutes, 1 hour, 2 hours, and 4 hours ahead.
It also indicates the standard deviation of the forecast value, which is compared with the standard deviation of volatility over a
local period of historical data. These values are variable and are significantly influenced by market quotation dynamics.
All data is sourced from the BTCUSDT futures market quotations of Binance. However, the forecasting results can be utilized for BTCUSDT in both the spot market and
quotations from other exchanges. The system outputs forecasts in the form of
quotation graphs for high and low values, with data updates occurring every 5
minutes.
1. DESCRIPTION OF THE
PHYSICO-MATHEMATICAL PRINCIPLES OF FORECASTING
The ideology of the forecasting
system is as follows. A specially
designed neural network searches for and extracts multifractal
structures over an extended historical period of quotations. These
multidimensional fractal structures, in the form of market patterns, influence
the future dynamics of market quotations. The extraction of structures is performed considering a specified length of historical
quotation data across all parameters of BTCUSDT: open, high, low, close,
volume. Based on the identified multifractal (similarity-based) structures, the neural
network is trained with the criterion of maximizing
forecasting efficiency for various timeframes. The effectiveness of the
forecasts is validated using classical approaches in
neural network training—on an independent verification dataset of quotations.
After obtaining the forecasting
model, it is applied to predict quotations.
Periodically, the neural network model undergoes retraining due to the
emergence of new historical data. This is a general outline
of the approach, which does not detail the many mathematical and technical
nuances that are crucial for developing effective neural network models.
As
practice has shown in the application of the system's forecasts, including the
creation of automated trading bots, the forecasting system effectively predicts
current market trends for BTCUSDT in the majority of market quotation
structures. Based on these forecasts, algorithms for equally effective “manual”
trading can also be developed.
2. WORKING WITH THE SYSTEM
Access to the forecasting system is provided through the TERESIUS_FORECAST
option. The user will be presented with a current
forecast chart, which updates every 5 minutes (see Figure 1).
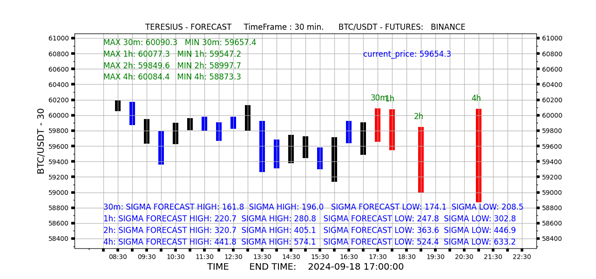
Fig 1. BTCUSDT Forecast Chart The
latest current values of candles (for high and low) on a 30-minute timeframe (Binance – futures market) are denoted
in black and blue on the chart. The forecasts, respectively for 30 minutes, 1
hour, 2 hours, and 4 hours ahead, are marked in red. IMPORTANT TO NOTE: In the upper left corner, the
maximum and minimum values for the forecasts (high and low) for each timeframe are displayed. At the bottom, the standard deviation of the
forecast for high and low values for each timeframe is
indicated. For comparison, one of the volatility indicators for high and
low is also provided, representing the standard
deviation of the high and low values in adjacent candles over the last 120
local candles (for each timeframe). This value is most
correlated with the forecasting error. Comparing the two values—the
volatility and the forecasting error based on the standard deviation—allows for
an assessment of the effectiveness of the specific forecast. It is
also important to highlight the following nuance: all forecasts for each
timeframe are made (in this system version) based on
completed candles. However, the time of candle formation naturally differs for
each timeframe. This can be significant when interpreting and applying
forecasts across different timeframes. Furthermore, it is essential to
keep in mind that forecasts for each timeframe are independent. They are
probabilistic in nature and are formed for various
overall graphical configurations of multifractals,
including temporal durations characterizing the multifractal.
This may sometimes lead to apparent contradictions in the characteristics of
forecasts across different timeframes. This
system offers evaluations of future quotations. The application of these
evaluations and trading algorithms entirely depends on the trader.